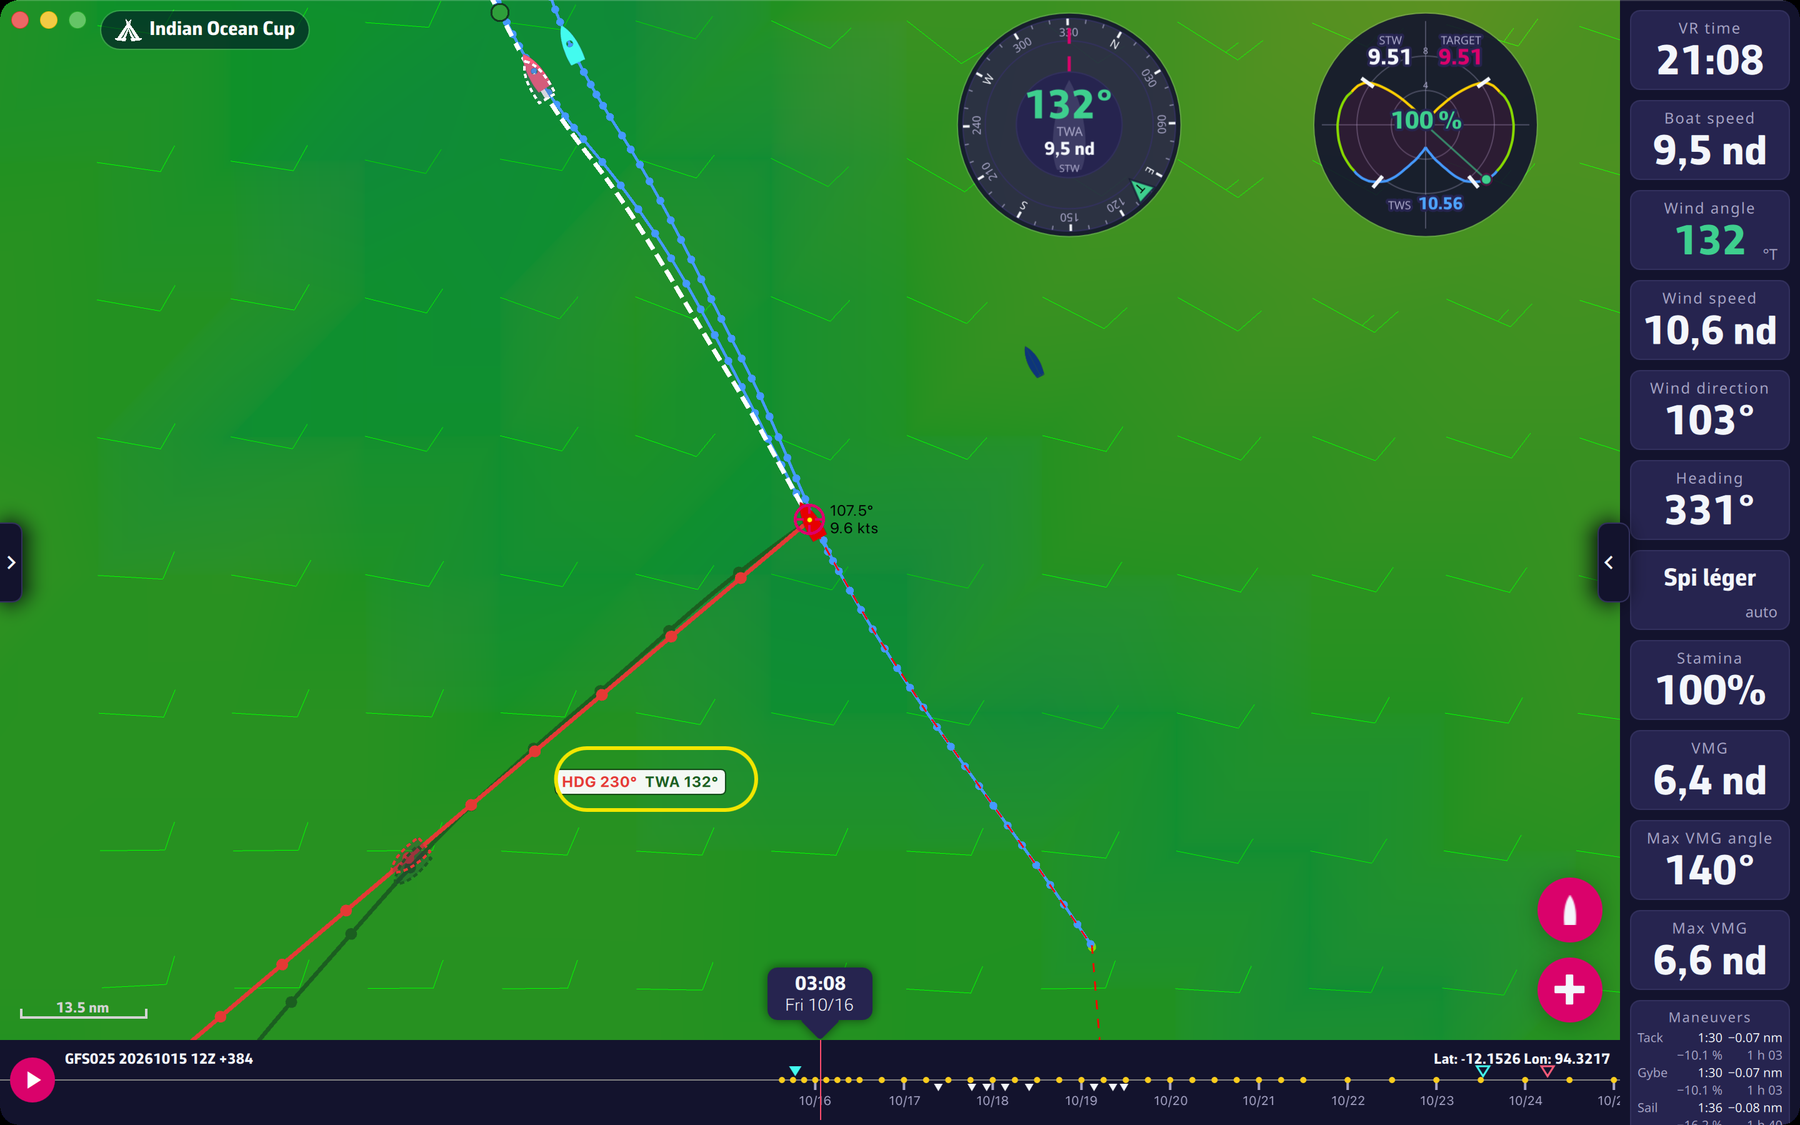
These are the boat’s two “lines”, switched on in Settings > “Display”: “Constant heading line” (red curve) and “Constant TWA line” (dark green curve). Each one shows where the boat would be over the next 12 hours if it kept its heading, or its wind angle (the TWA), using the winds forecast by the GRIB. A dot marks each hour, and a boat silhouette follows the timeline’s time cursor.
On a computer, the curves pass through the mouse pointer, and a label gives the heading and TWA to aim for.
Going further: Reading the constant TWA and constant heading curves.